A Public School
Manifesto
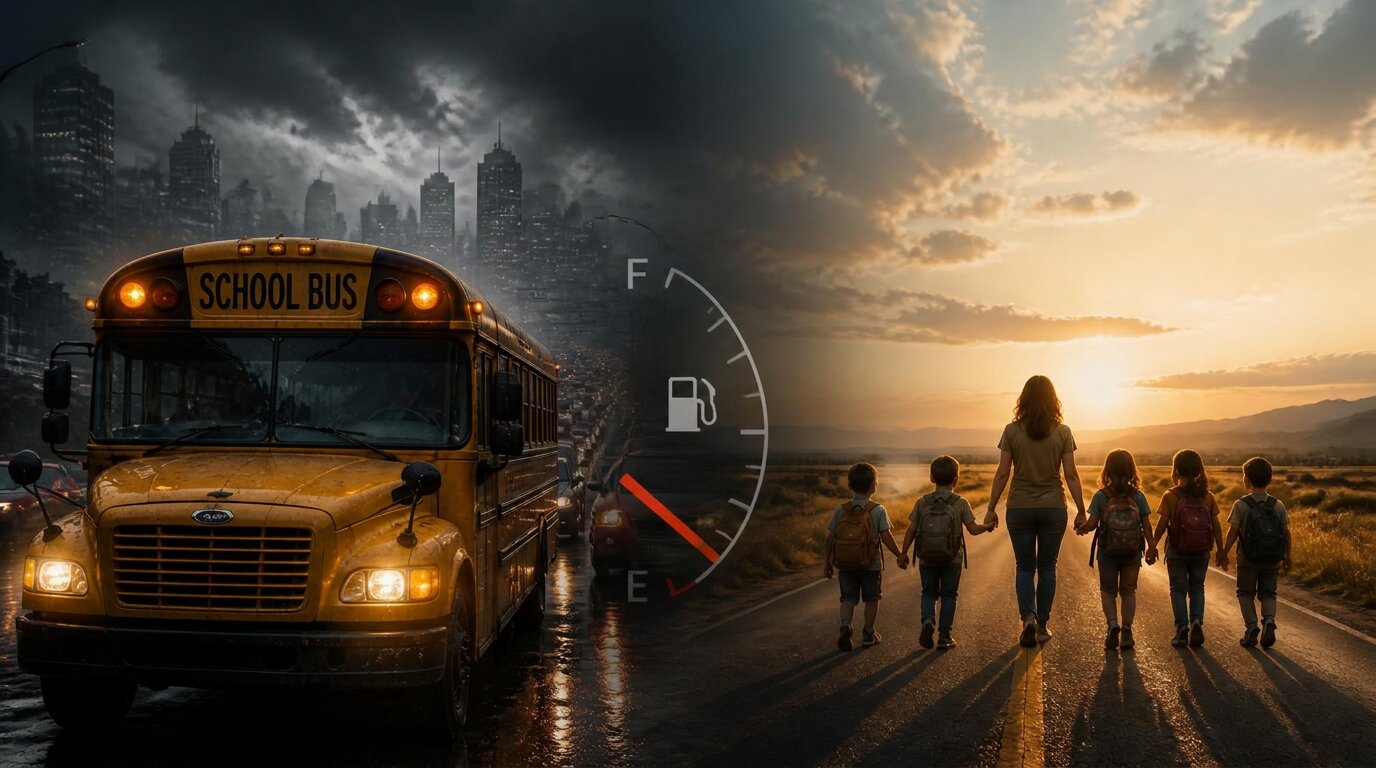
An investigation into why America's schools are working harder—while too many students are learning less.
Something doesn't
add up.
This didn't start with COVID.
Rising investment, declining student achievement, and educator burnout were already evident before the pandemic.
What changed dramatically afterward was chronic absenteeism.
- EVIDENCE 01
Record investment.
- EVIDENCE 02
Student achievement moved in a different direction.
- EVIDENCE 03
Highest burnout of any U.S. profession.
- EVIDENCE 04
Chronic absenteeism nearly doubled since 2019.
Exhibit One
This isn't one district.
It's a national conversation.
CHOOSE YOUR STATE
Exhibit Two
Investment continued to rise.
Student achievement moved in a different direction.
Exhibit Three
National reading and mathematics trend, 2013–2024
NAEP · Grade 4 average scale scores · The Nation's Report Card
Investment · U.S. per-pupil current expenditure, inflation-adjusted · Shown on its own scale
Behind the numbers
The numbers have a human shape.
Highest burnout of any U.S. profession
Gallup · K–12 workers
Chronic absenteeism nearly doubled since 2019
U.S. Department of Education · National Center for Education Statistics
And yet
Hang on.
This isn't happening everywhere.
108 districts gained in both reading and mathematics.
More than 13,000 public school districts. These 108 moved against the larger trend.
Education Recovery Scorecard · May 2026
Same pressures.
Different results.
So what are they doing differently?
District of Columbia Public Schools
Washington, D.C.

Reading and math both above pre-pandemic levels.
Compton Unified
California

Sustained gains across grade levels and demographics.
Cambridge Public Schools
Massachusetts
Full recovery in reading; math ahead of 2019.
Solon City Schools
Ohio
Among the districts with strongest combined growth.
Mobile County Schools
Alabama
Significant gains in both subjects despite similar pressures.
Jefferson County Public Schools
Kentucky

Sustained recovery in reading and math across a large urban district.
Source · Education Recovery Scorecard, 2026
Which is why
Public schools don't look the same
from every seat.
The school you just experienced looks different depending on where you sit. Understanding begins when we start where we are—and remain willing to see from somewhere else.
Four seats. One conversation.
Choose your seat.
You know public schools from where you sit.
Start there.
Before you choose, hear from the other seats.
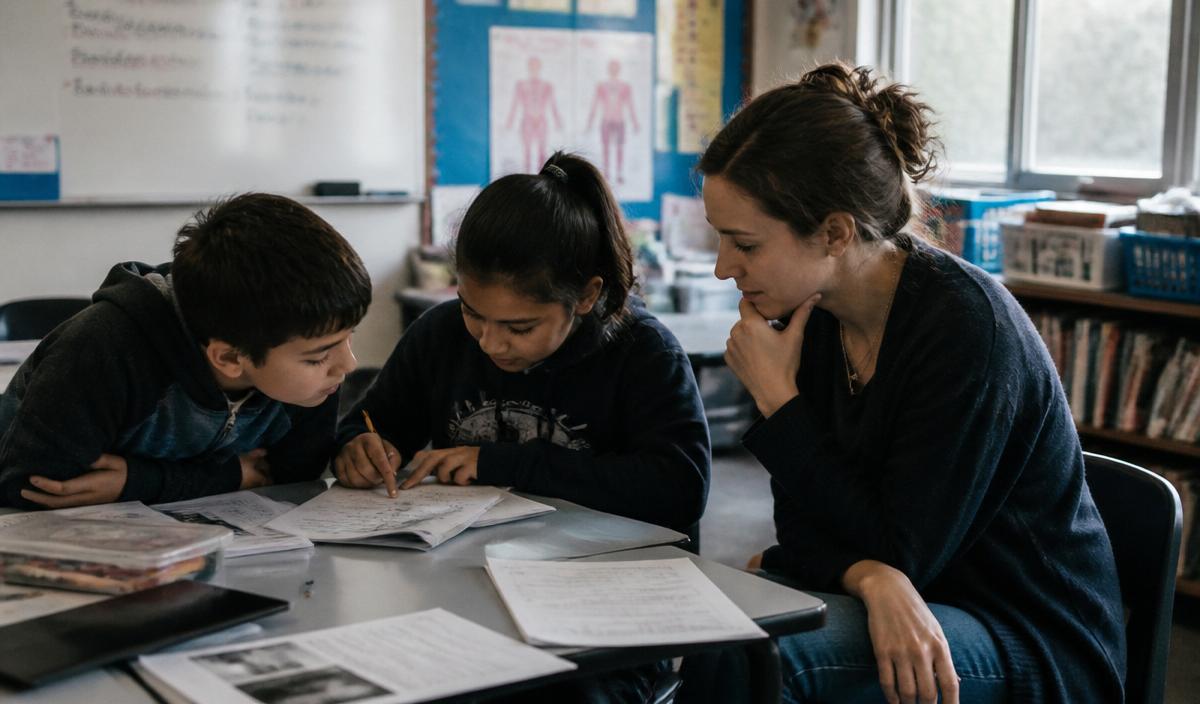
Teacher & Coach
You carry the daily work of turning expectations into learning.
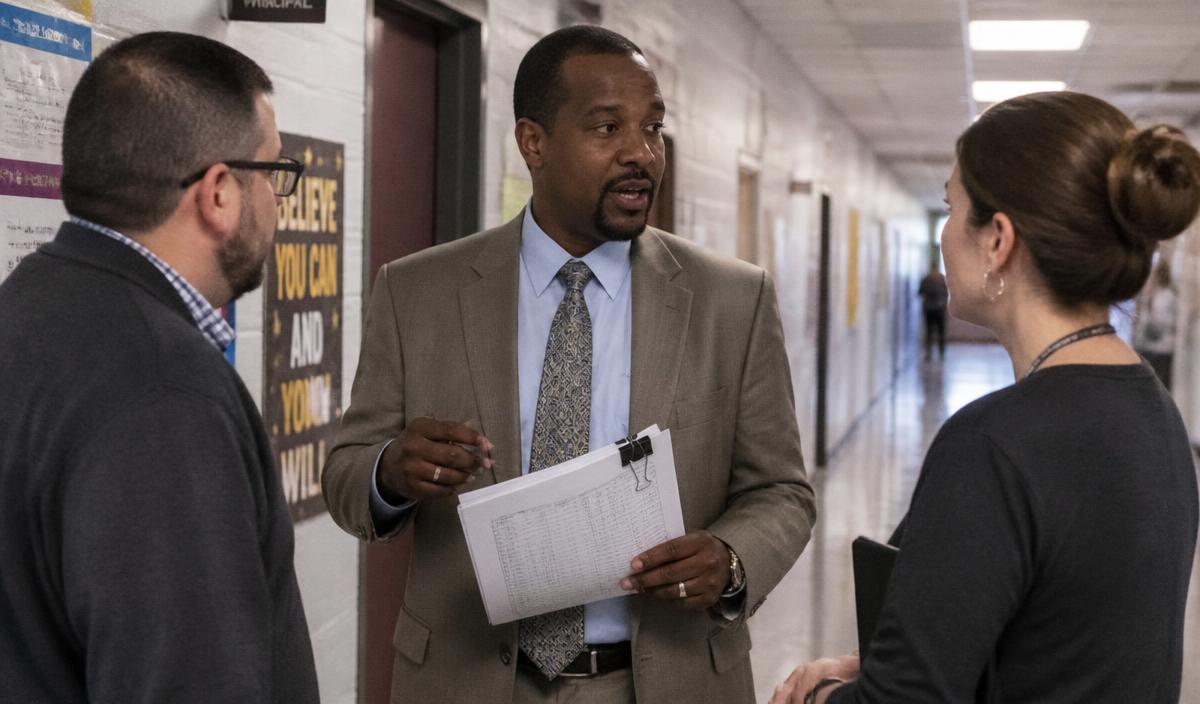
Building & District Leader
You carry decisions, priorities, people, and problems that rarely fit inside the calendar.
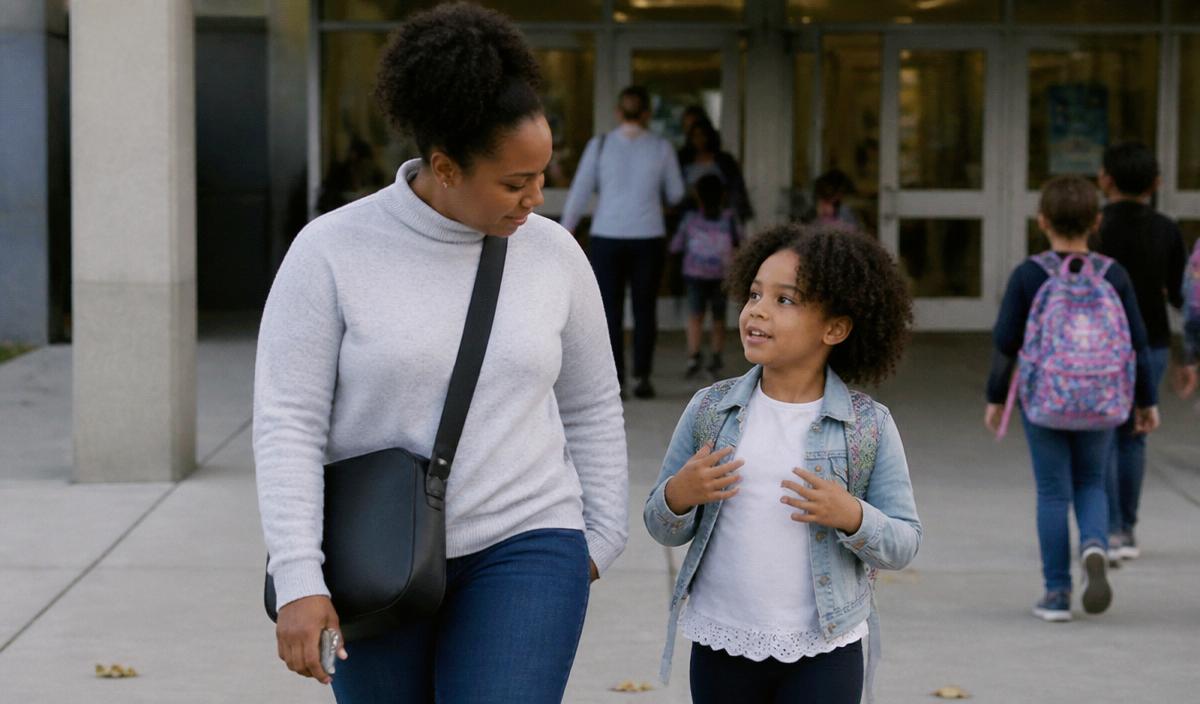
Parent & Community
You experience school through the life, learning, and well-being of a child.
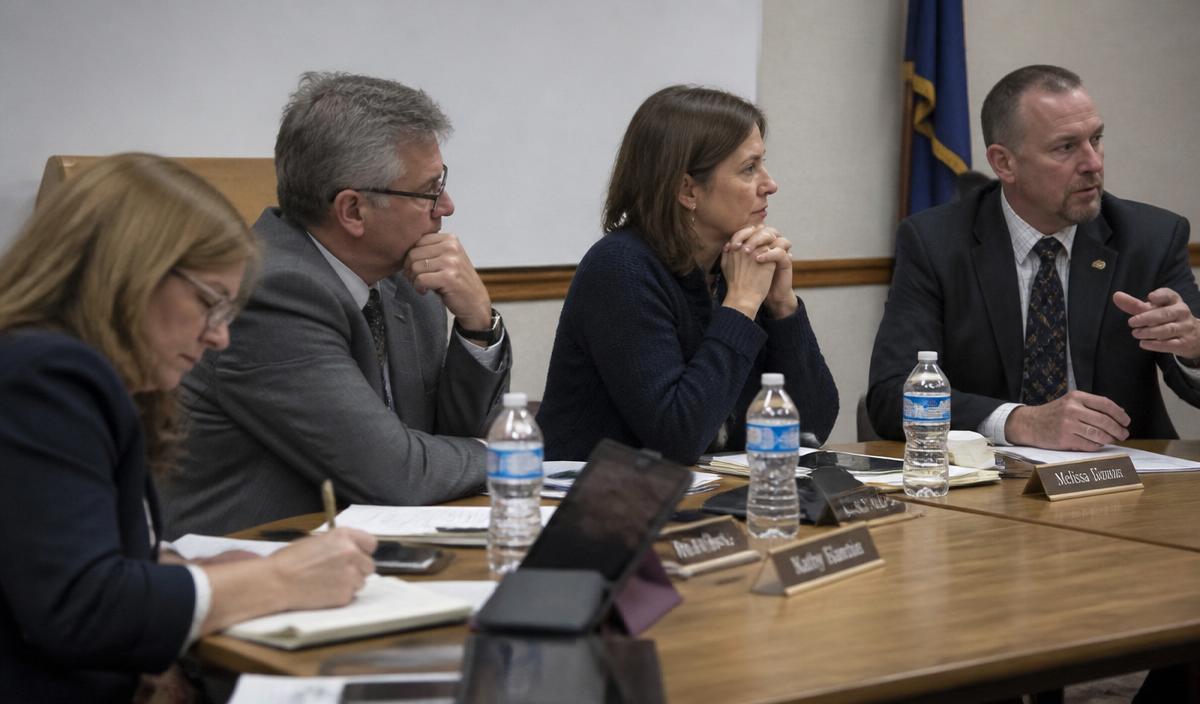
Board Member & Community
You help shape the priorities, resources, and conditions that eventually reach classrooms.
Already walked a seat?
Continue the Investigation
The investigation doesn't end here. Continue exploring the evidence, revisit the experience, or examine the complete archival record.